This has led me to look for sources to help students improve their diagrams. I have put together my own characteristics as well. Things like including the cloud in the top left corner since we read left to right and top to bottom; not including a firewall icon unless you are specifically recommending a hardware firewall as part of the design, etc.
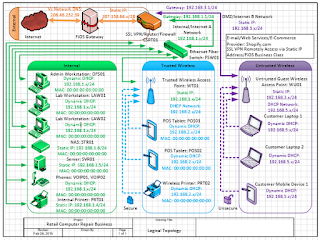
But, I also learn a lot from my students. After all, one of the reasons I got into academia was because I love to learn. each semester, I learn things from students who also happen to be practitioners. One semester, I had a student who submitted some of the best designs I have ever seen. They were easy to read, logically developed, and top notch all the way. The student did an excellent job of using color to represent open and secured parts of the network. The student logically grouped clients and included important configuration information to aid in configuration and troubleshooting. The student did a phenomenal job. See Figure 1 below for an example of the diagram he submitted to a case the class was presented with.
 |
| Figure 1: Logical Design |
Of course, it does not end with the diagram itself. And, lest I lead you astray, you should not start off with your diagram. Rather, your diagram should be inserted immediately following the first paragraph in which it is mentioned. Which brings me to another point; all tables and figures should be labeled. In our case, this if "Figure 1: Logical Diagram".
A THOROUGH narrative is necessary as you can never be sure about who might be reading your documentation. Some may be more visually responsive while others may respond better to narrative. Your narrative needs to clearly explain in plain English what you are trying to communicate in the diagram. In some cases, you can communicate things via your narrative that you cannot with your diagram alone. For example, using your narrative, you can explain some of the design choices made. Why are you including an unsecured wireless access point to your design? Since you are not aware of how technical the person is who might be reading your proposal, you need to include both enough technical aspects to address that persons questions but also explain things in plain English for those decision makers who may have the say on whether or not your proposal gets approved but lack the technical background of others.
A THOROUGH narrative is necessary as you can never be sure about who might be reading your documentation. Some may be more visually responsive while others may respond better to narrative. Your narrative needs to clearly explain in plain English what you are trying to communicate in the diagram. In some cases, you can communicate things via your narrative that you cannot with your diagram alone. For example, using your narrative, you can explain some of the design choices made. Why are you including an unsecured wireless access point to your design? Since you are not aware of how technical the person is who might be reading your proposal, you need to include both enough technical aspects to address that persons questions but also explain things in plain English for those decision makers who may have the say on whether or not your proposal gets approved but lack the technical background of others.
Regardless, know that this is an art. The more you practice, the better you get. So, practice, practice, practice. Get good at this. It will be an invaluable skill.
No comments:
Post a Comment